Quickstart
Obtaining the Hotrod Binary
The latest version of Hotrod is available here:
Download HotrodDepending on Your platform, the download will provide you with either a gzipped or zipped file, containing the Hotrod Binary.
Running Hotrod
Once extracted, open a terminal and start Hotrod Server in stand-alone mode.
On Linux, Windows, and pre-M1 Apple Macs, use:
hotrod run stand-alone
On Apple Macs running M1 or later CPUs, use:
arch -x86_64 hotrod run stand-alone
When first run, you will be presented with the Panoptix End User License Agreement.
With default configuration, Hotrod's UI and API will be served at http://localhost:3000. If that port is occupied by another service, you can change the bind port with:
hotrod run stand-alone --bind-address localhost:3003
If you accepted the EULA, Hotrod Server will start, and print the following output:

Among the logs you see, you will notice:
- An automatically-generated password that you will use to log into the User Interface.
- The address you will use to access the User Interface; You can copy this address and paste it into your browser or type it in manually.
Please take note of your password, we also recommend that you change it as soon as possible.
Logging into the User Interface
In a browser, navigate to http://localhost:3000 (or the appropriate port if you changed it). You will be presented with the Login Screen:

Use the default username "admin" as well as the password that was generated in the previous section. These credentials can be changed after accessing the User Interface.
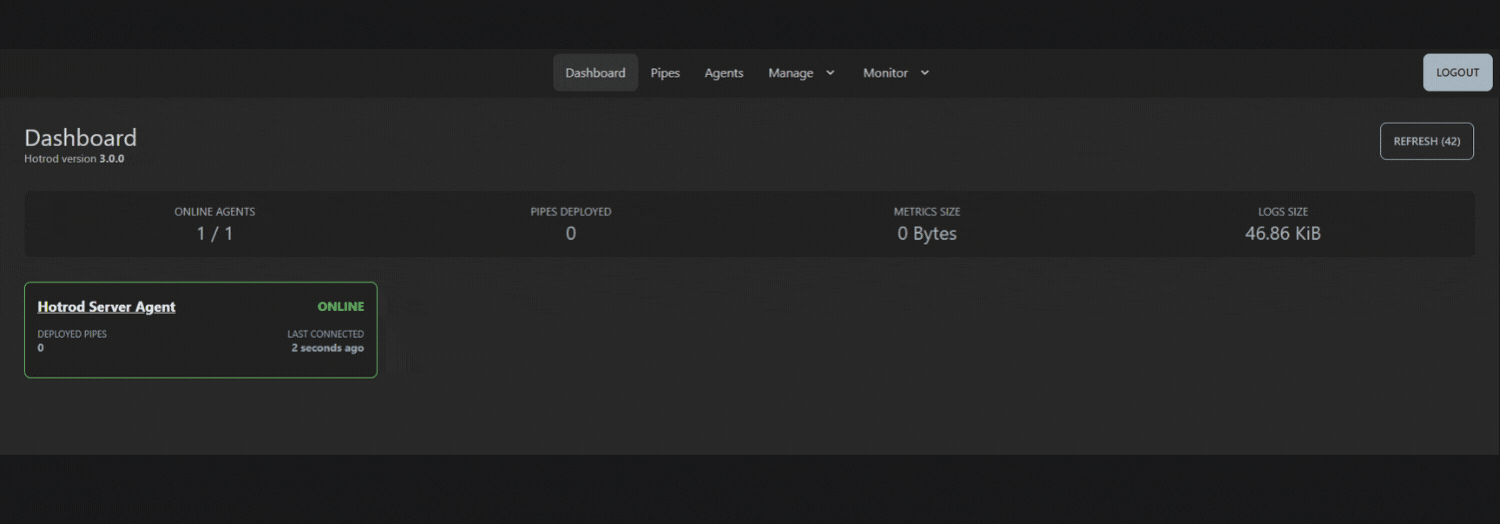
Once logged in, the Hotrod Dashboard will indicate one online agent, which is the server-internal agent started by using stand-alone mode.

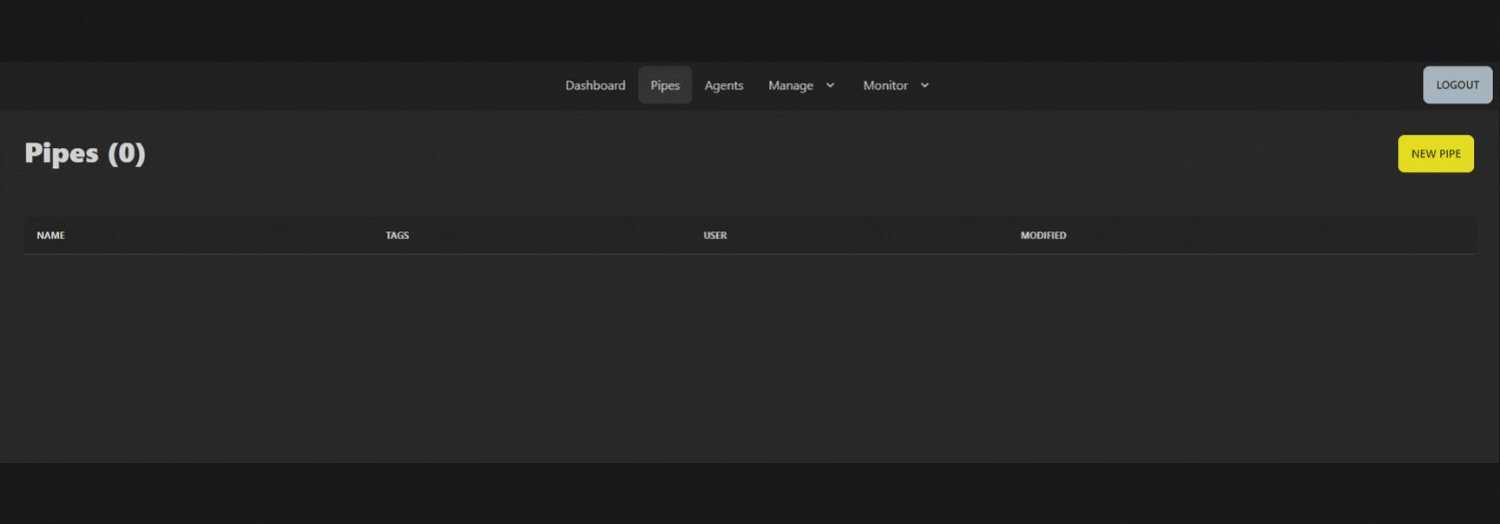
Creating your first pipe
Click on the Pipes Tab in the top navigation.
Above the Pipes List - which is empty at this point - click on the New Pipe button:
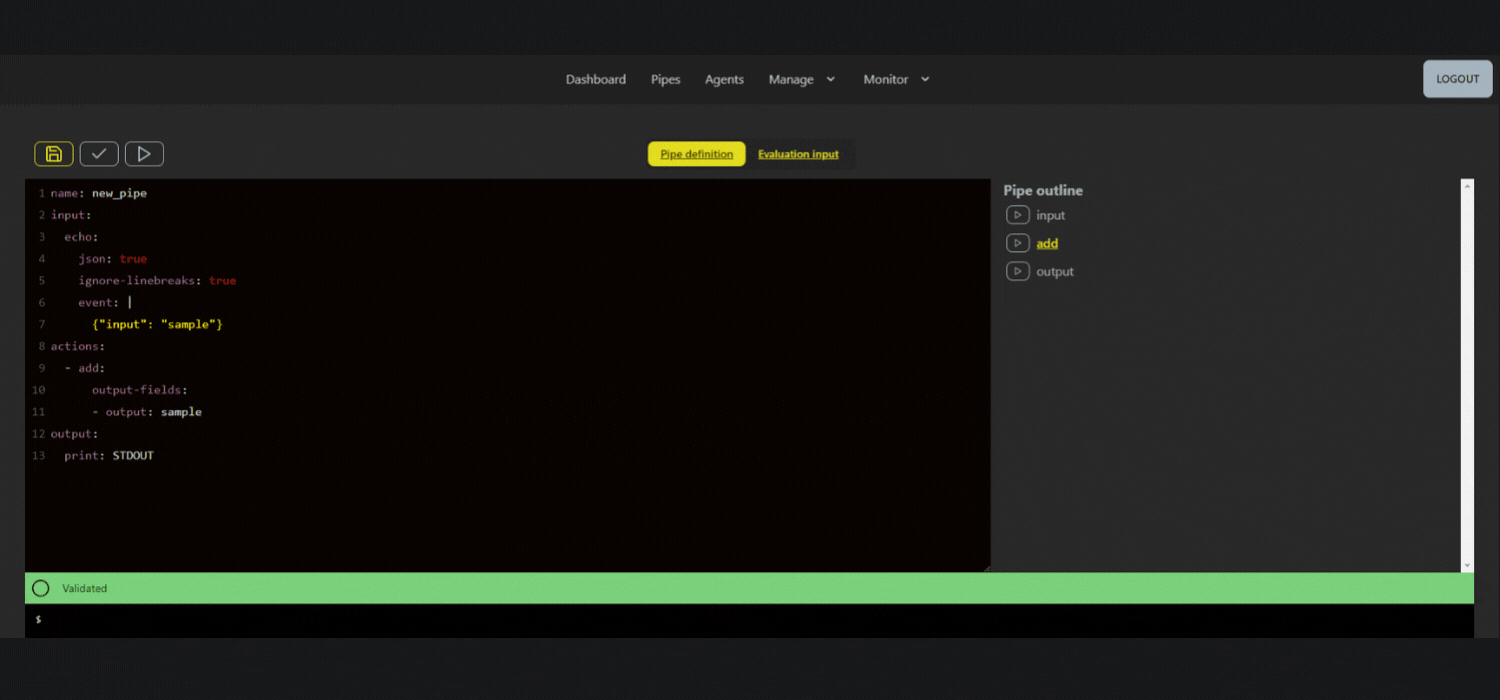
This opens the pipe editor.
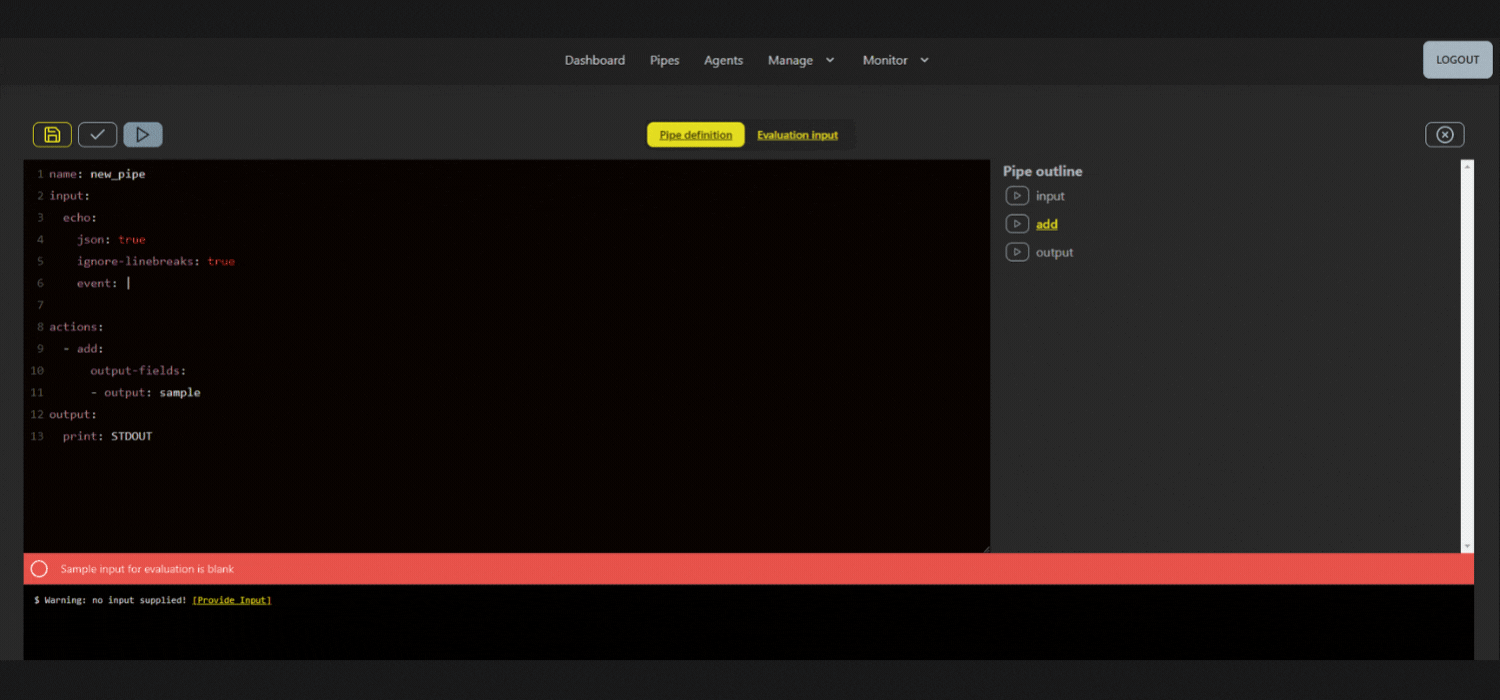
On the left, you will notice the Pipe Definition field that includes a minimal pipe template, containing the standard elements of a pipe definition:
1. A mandatory pipe name
name: new_pipe
2. An input
input:
  echo:
    json: true
    ignore-linebreaks: true
    event: |
      {"input": "sample"}
3. A list of actions
actions:
  - add:
      output-fields:
      - output: sample
4. An output
output:
  print: STDOUT
Validating pipe definitions
Use the Validate button - highlighted below - to check pipe definition. The validation function checks both YAML syntax errors, as well as the pipe language, which we also call the Hotrod DSL (domain specific language).
To check that a pipe definition is working correctly, click on the Validate button. After clicking this button, a notification will indicate whether the pipe definition is valid, or if it has any YAML or DSL issues.
Evaluating sample input
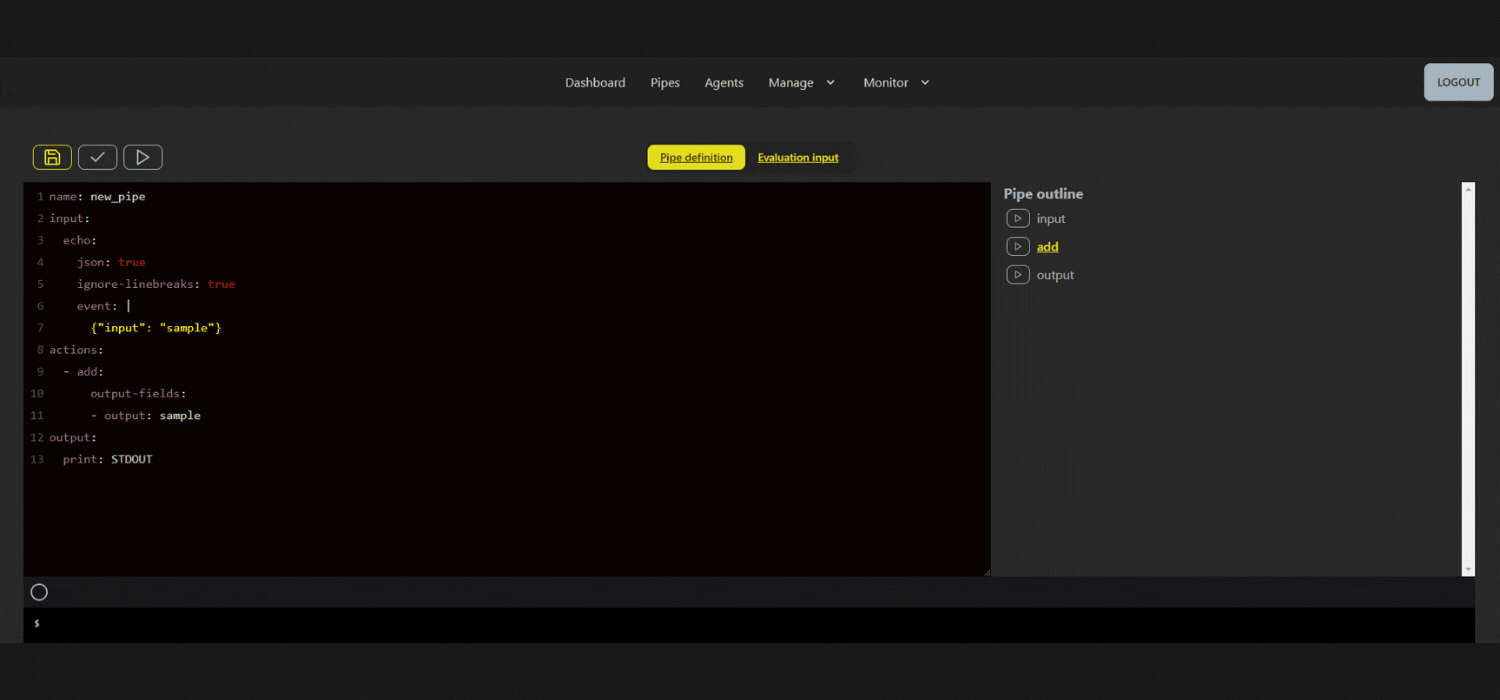
To evaluate the pipe against the input, click on the Play button. If successful, you'll receive a green notification with confirmation that the pipe has been evaluated.
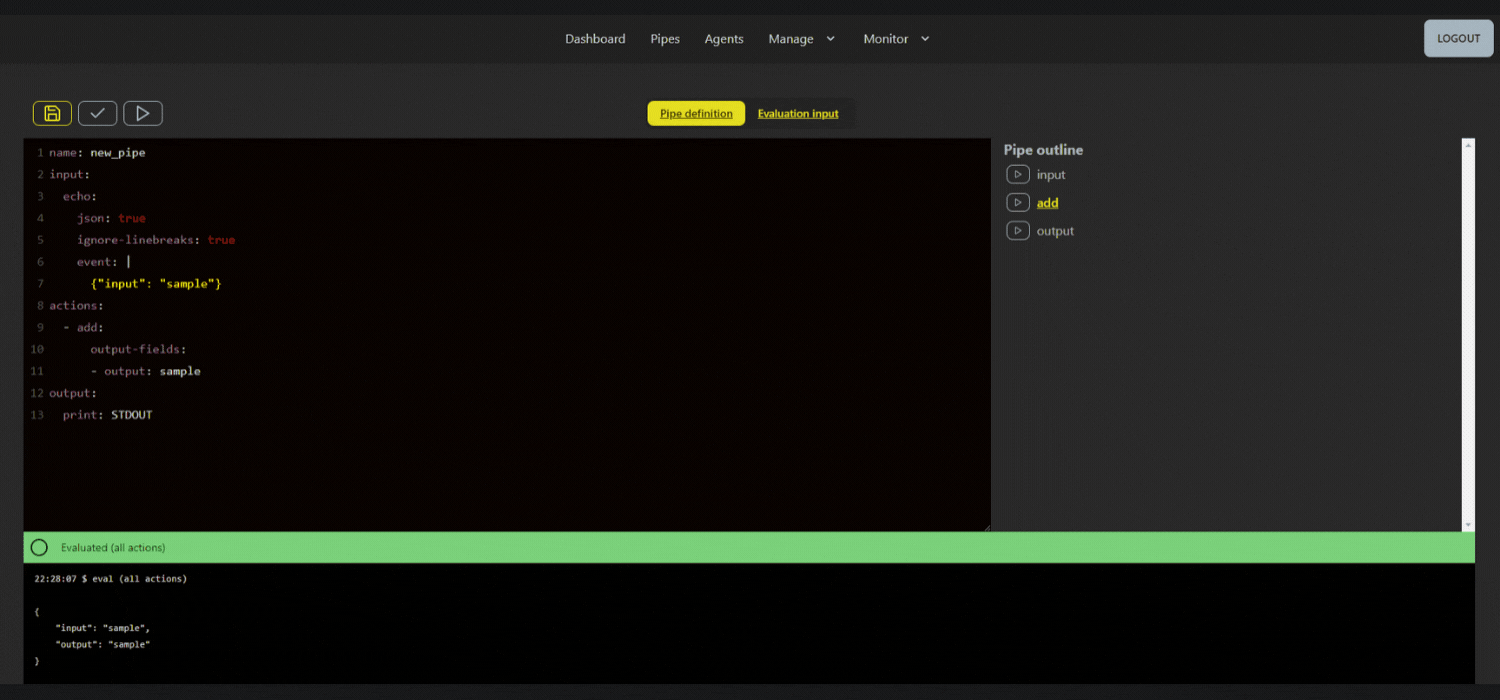
The default pipe template contains an echo input, and the editor will automatically copy it's event data to the "Evaluation Input" tab.
If there's an error, you will receive a red notification indicating e.g. that the sample input for evaluation is blank. In this case, you will notice an error message in the Result Field with a link to provide input.
Viewing sample output against input
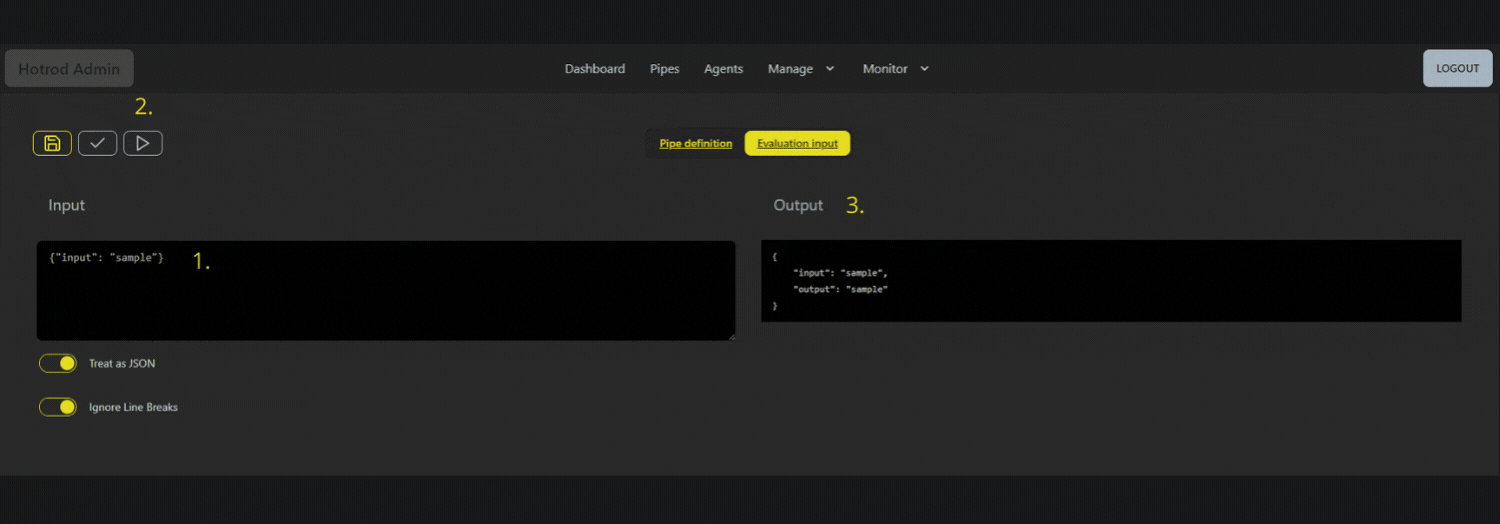
To view a sample of the pipe's output, click on the Evaluation Input button.
In the Evaluation Input View, you can:
- type or paste an input sample in the Input Field,
- then click on the Play button
- inspect the output result in the Output Field as shown below.
Hello World!
Let's create a field named "hello" that displays a text value of "world". We can do this by simply changing the echo input's event field, but let's employ some DSL actions.
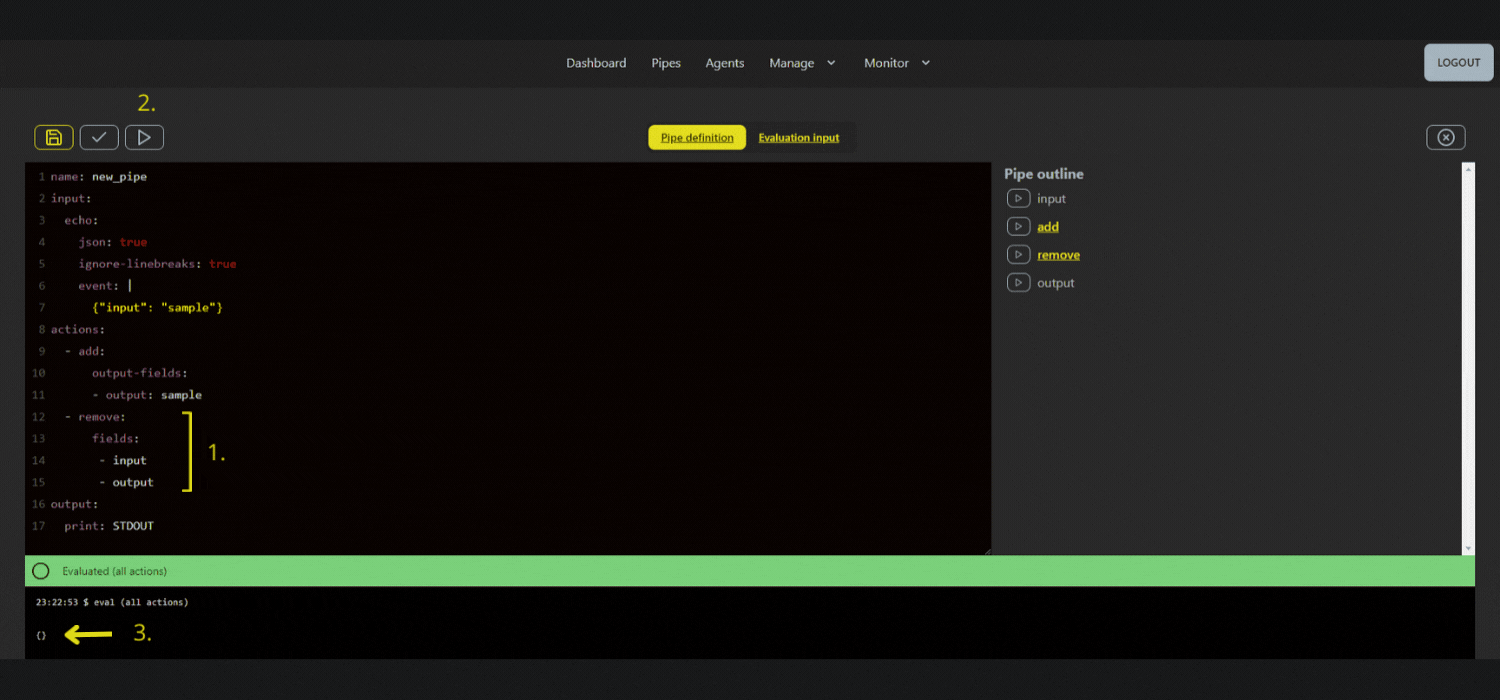
First, remove the two existing fields by adding a remove action to the bottom of the actions section in the Pipe Definition, as seen in the screenshot that follows:
  - remove:
      fields:
       - input
       - output
Below are the steps to follow:
- type or paste the remove action into the Pipe Definition.
- click the Play button.
- notice an empty event displayed in the Result Field, indicating that the fields were successfully removed.
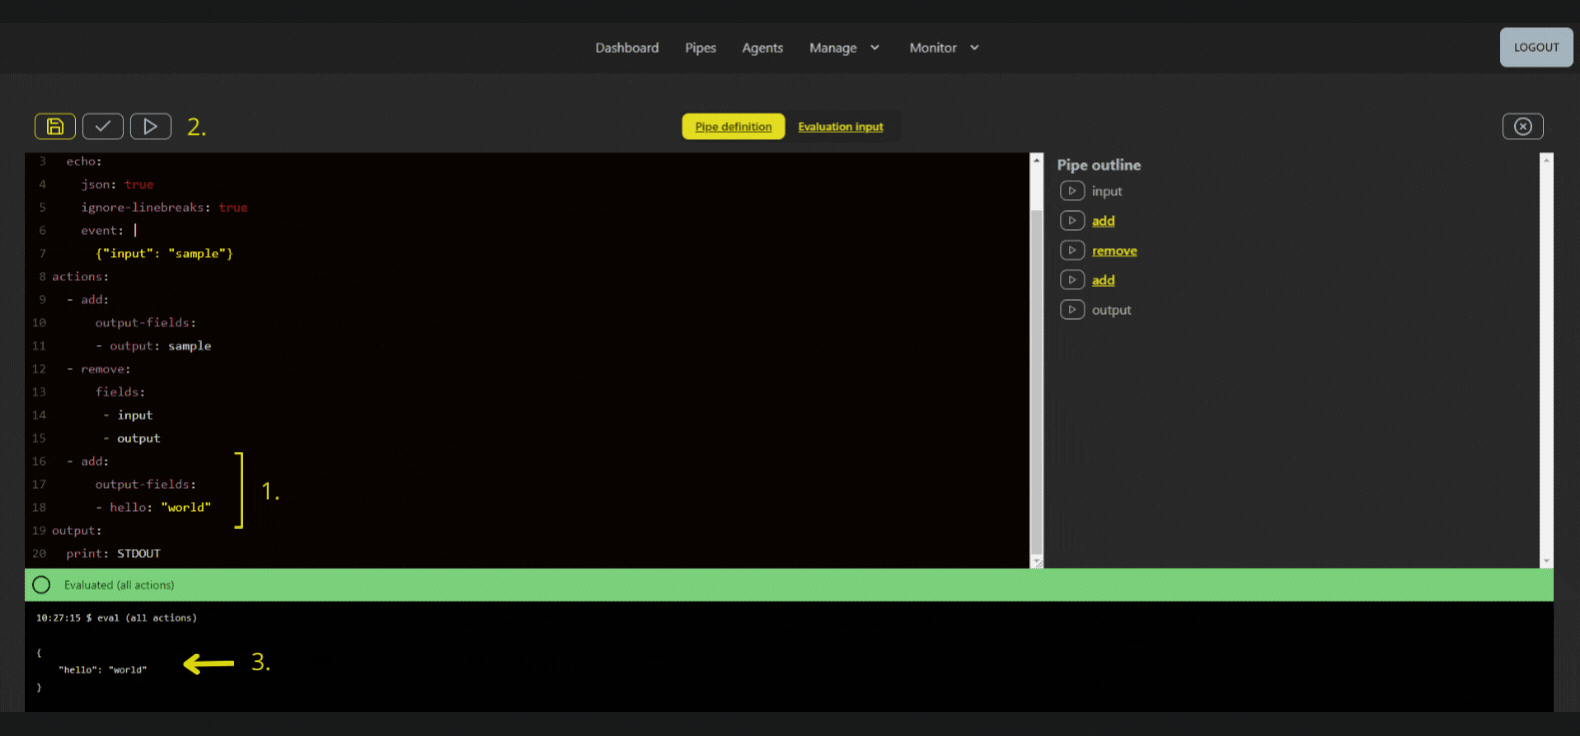
Finally, to add the "hello" field along with its value "world", create the following action in the Pipe Definition:
  - add:
      output-fields:
      - hello: "world"
Below are the steps to follow:
- type or paste the add action in the Pipe Definition
- click the Play button.
- notice
"hello": "world"being displayed in the Result Field.
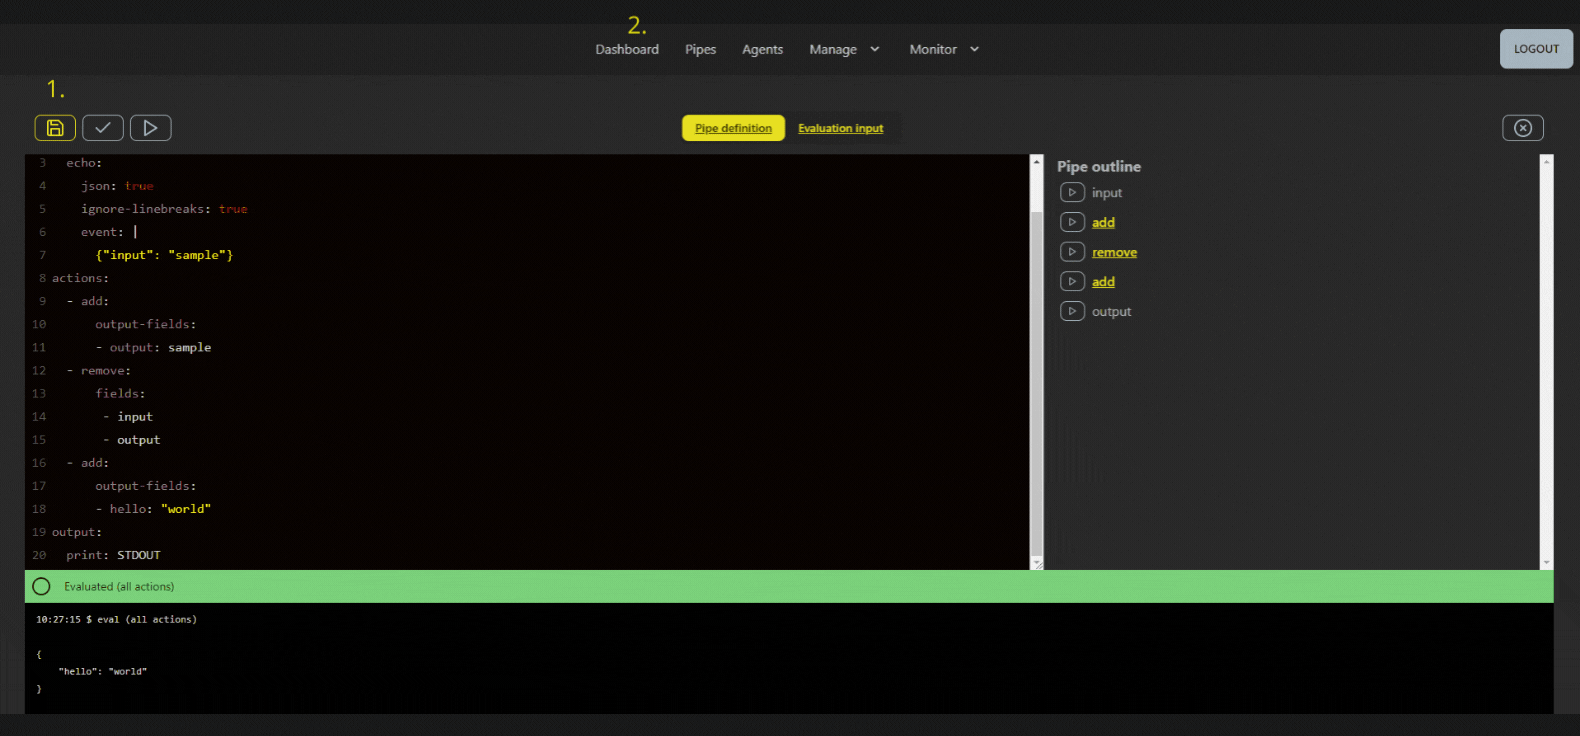
You can now:
- click the Save button.
- then, click the Pipes Tab to go back to the Pipes List.
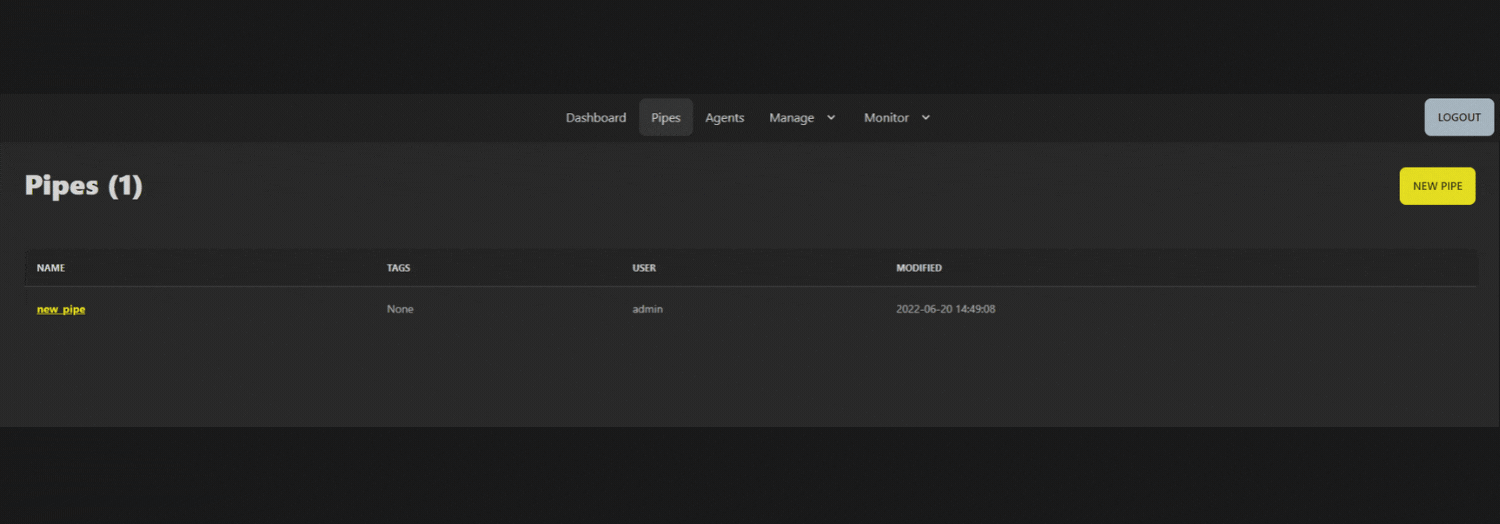
Once back in the Pipes List, you'll notice Pipes(1) displayed along with data about the pipe.
Now, click on the pipe name as indicated below, to go into the Pipe View.
Adding a pipe to an agent
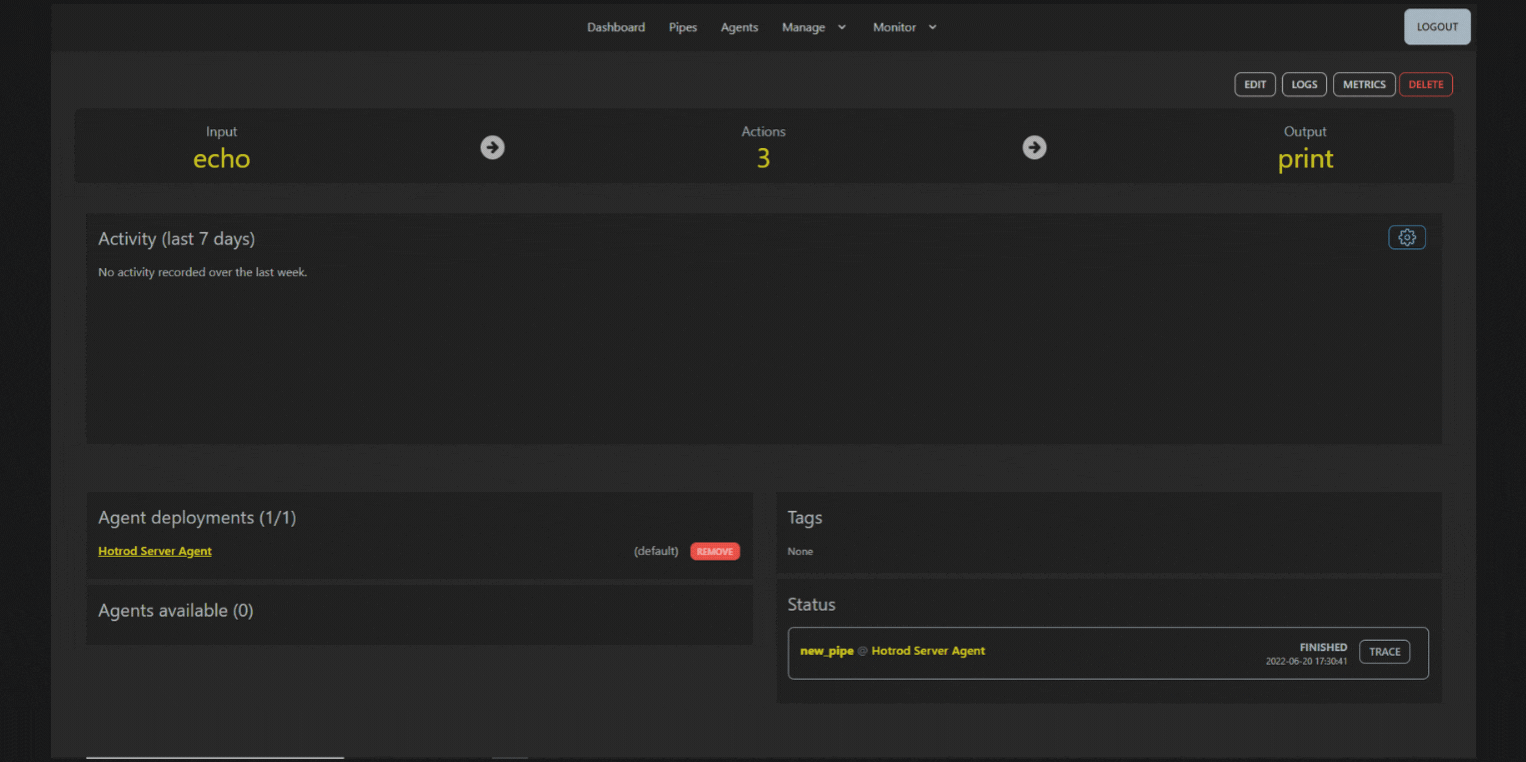
Once in the Pipe View, you can see information about the pipe:
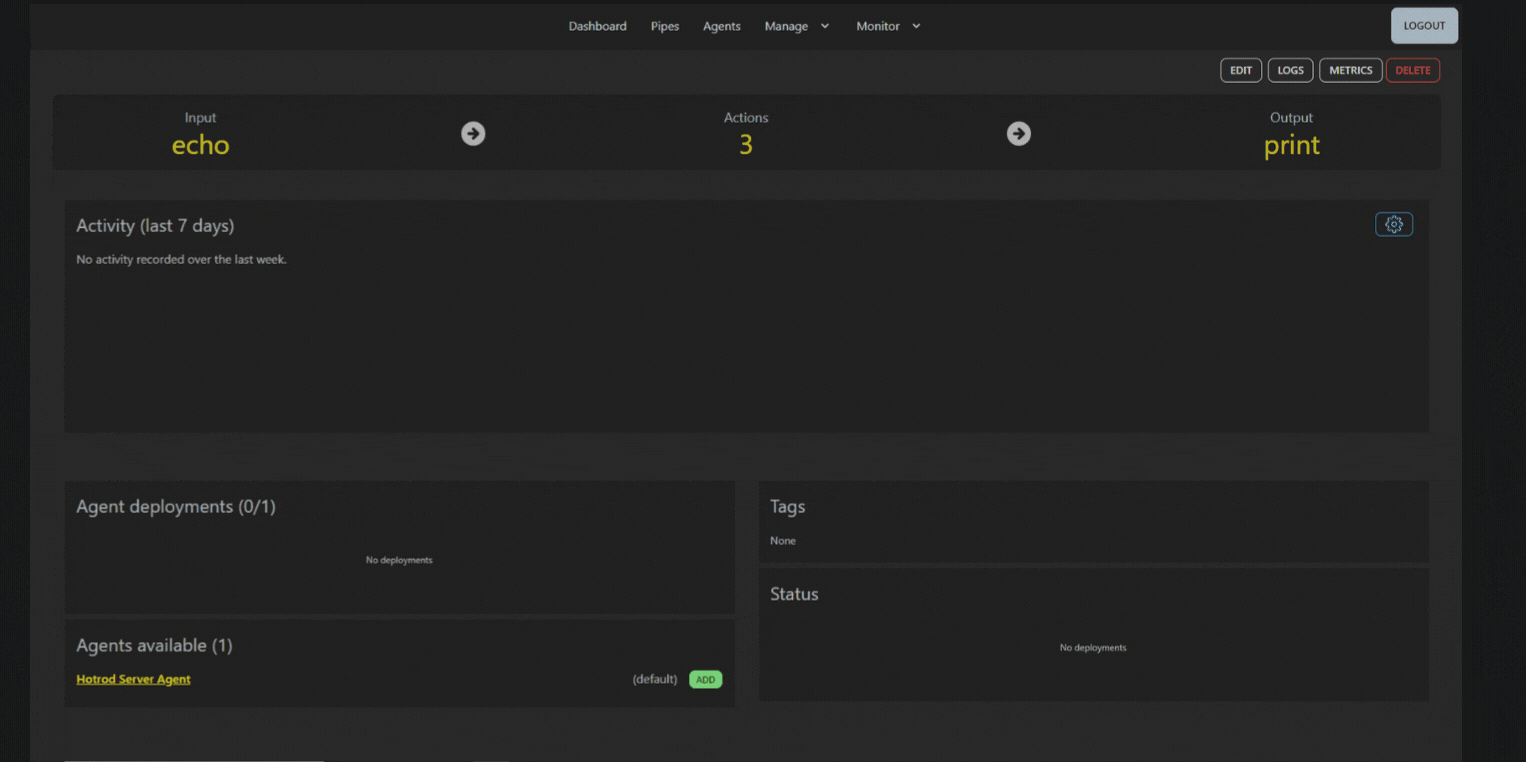
Firstly, you will see the "Hotrod Internal Agent" under the "Agents available" section.
To add the new pipe to the internal agent, click on the Add button next to the agent name.
Then, switch to your terminal window where Hotrod Server is running. You should see the pipe's output towards the end of the output:
{"hello":"world"}

We're seeing the pipe's output in the Server's output for two reasons:
- The pipe uses the print output, to STDOUT.
- The pipe is executed by the internal agent running within the Hotrod Server process
Adding an interval to the pipe
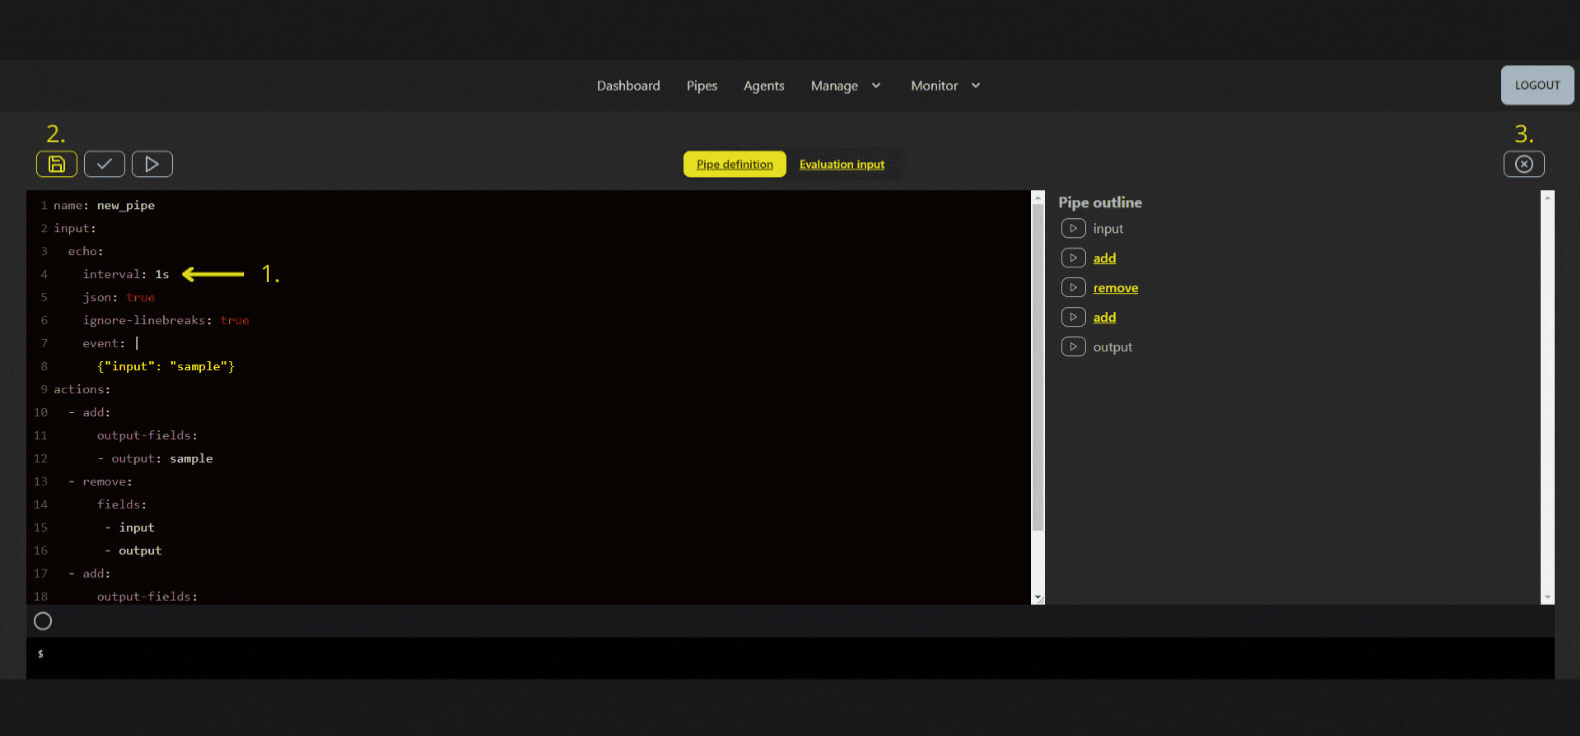
Coming back to the User Interface, click the Edit button to return to the Pipe Editor.
Then, add the following interval field to the pipe definition's echo input, as shown in the screenshot that follows.
interval: 1s
Below are the steps to follow:
- type or paste the interval field and set it to 1s.
- click the Save button.
- close the Pipe Editor by clicking the Close button.
Within a few moments, {"hello":"world"} should appear in the terminal window every few seconds, as per the specified execution interval we just added.
When saving a pipe definition, Hotrod automatically redeploys updated pipe definitions to all agents which the pipes are attached to.
Now, in the Pipe View:
- notice the pipe's status displaying "started".
- click on the Dashboard Tab to view the status of the agent.
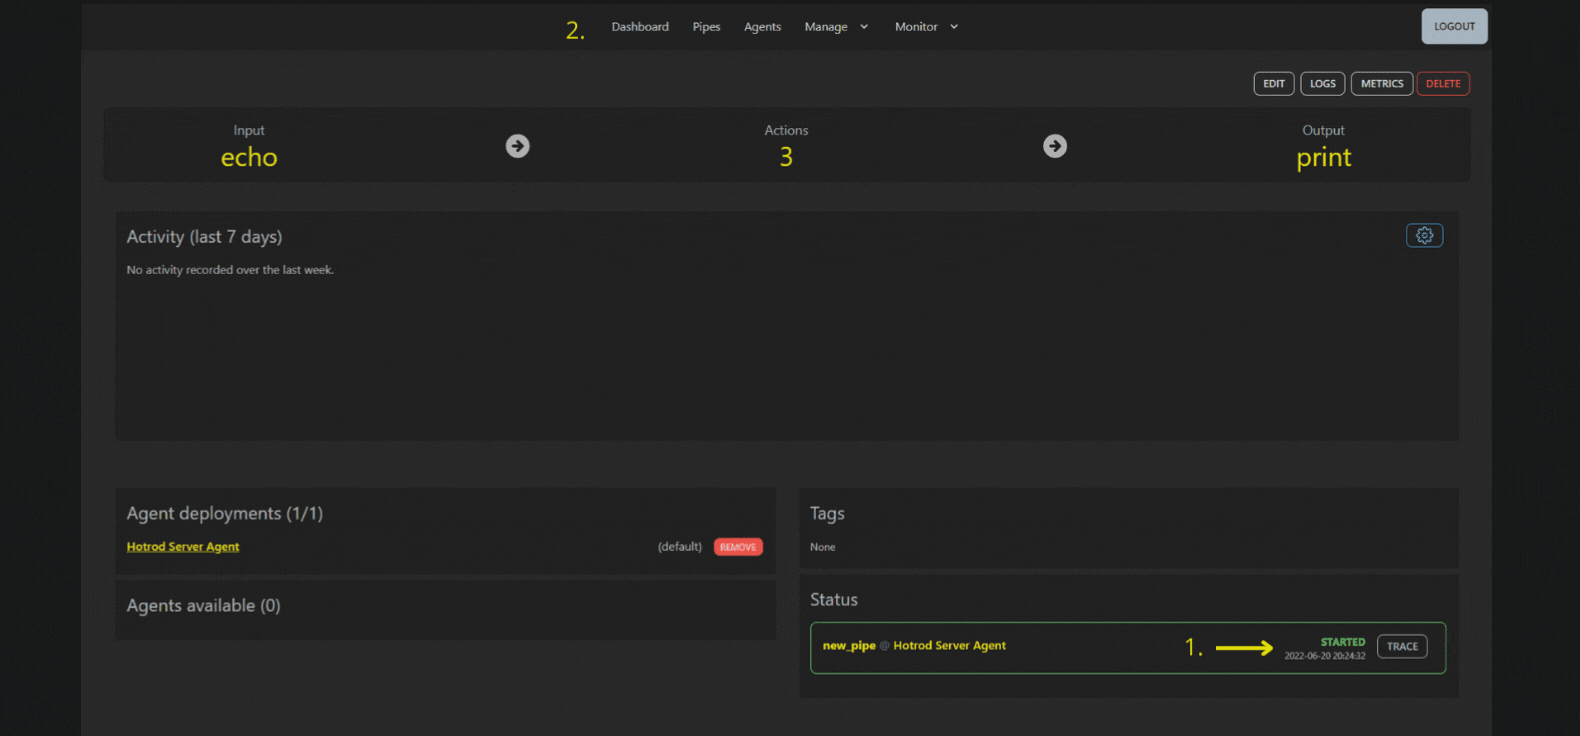
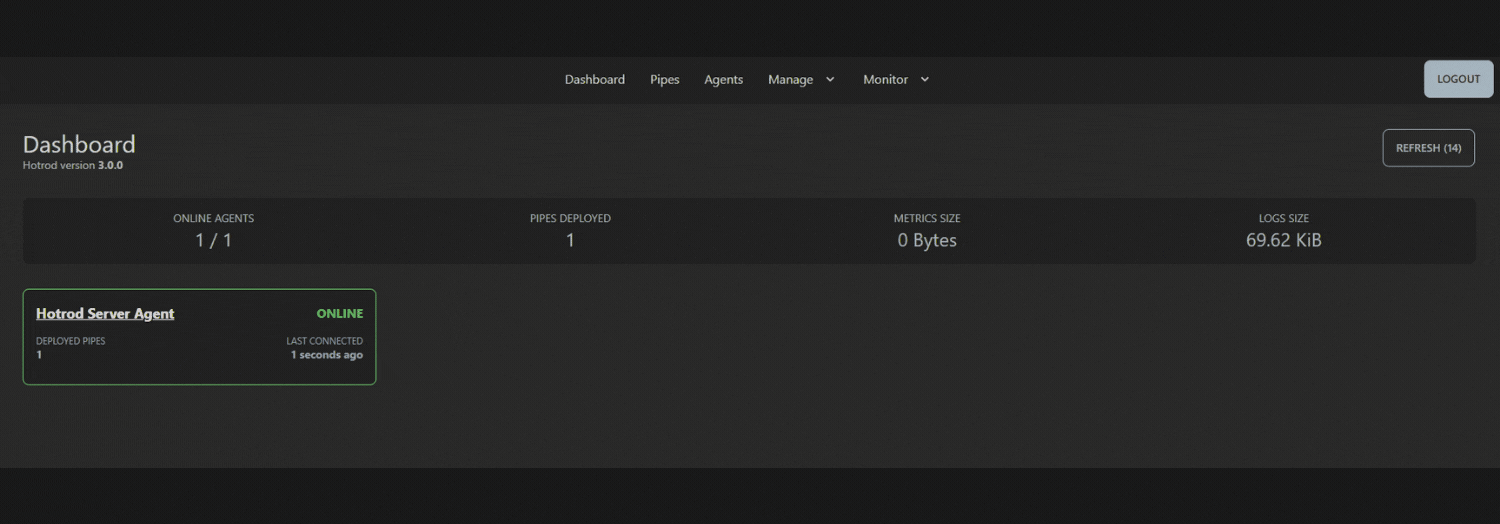
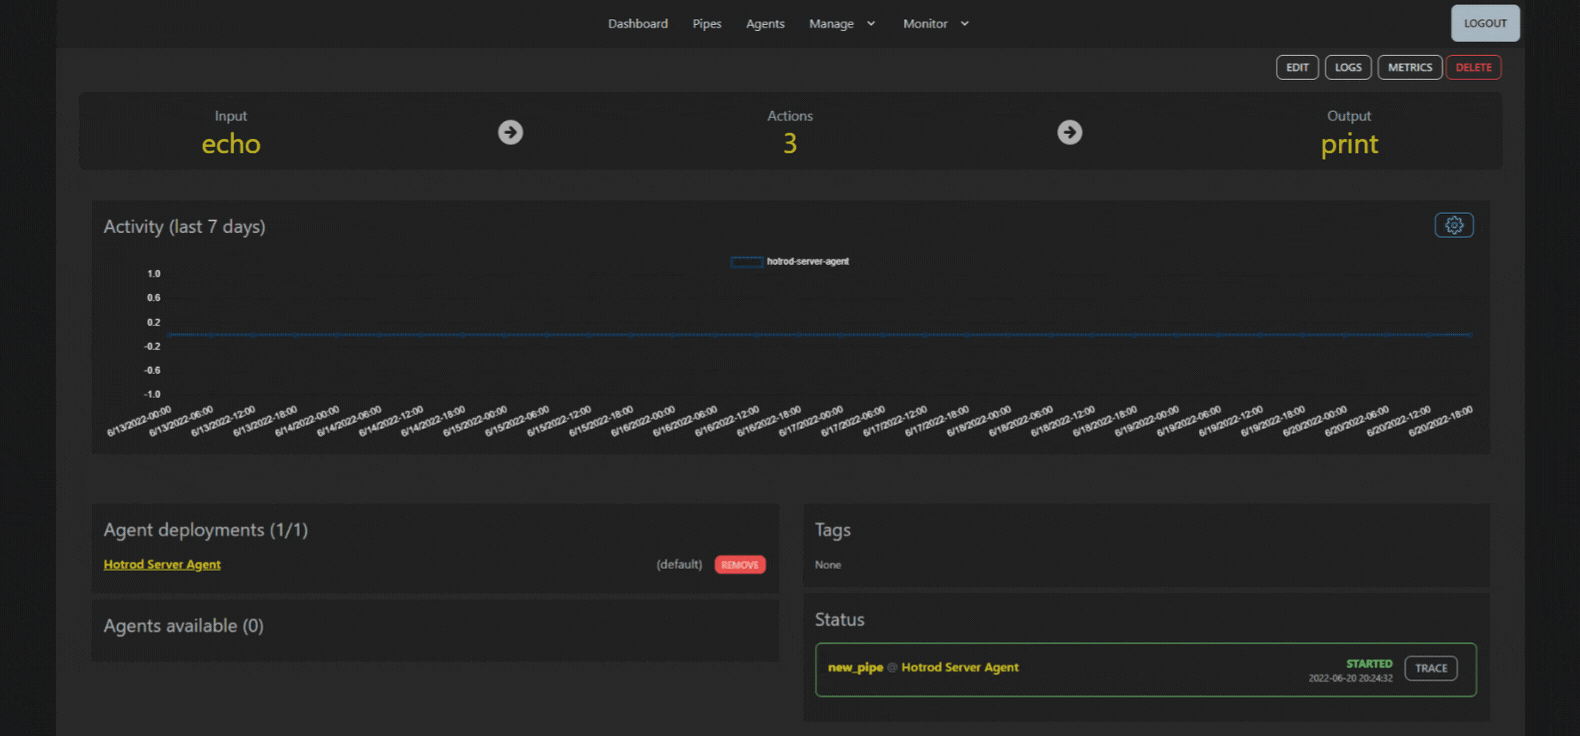
Back on the Dashboard you will notice where the agent status is displayed, it now reflects a deployed pipe count of "1". Now, click on the agent name to go into the Agent View.
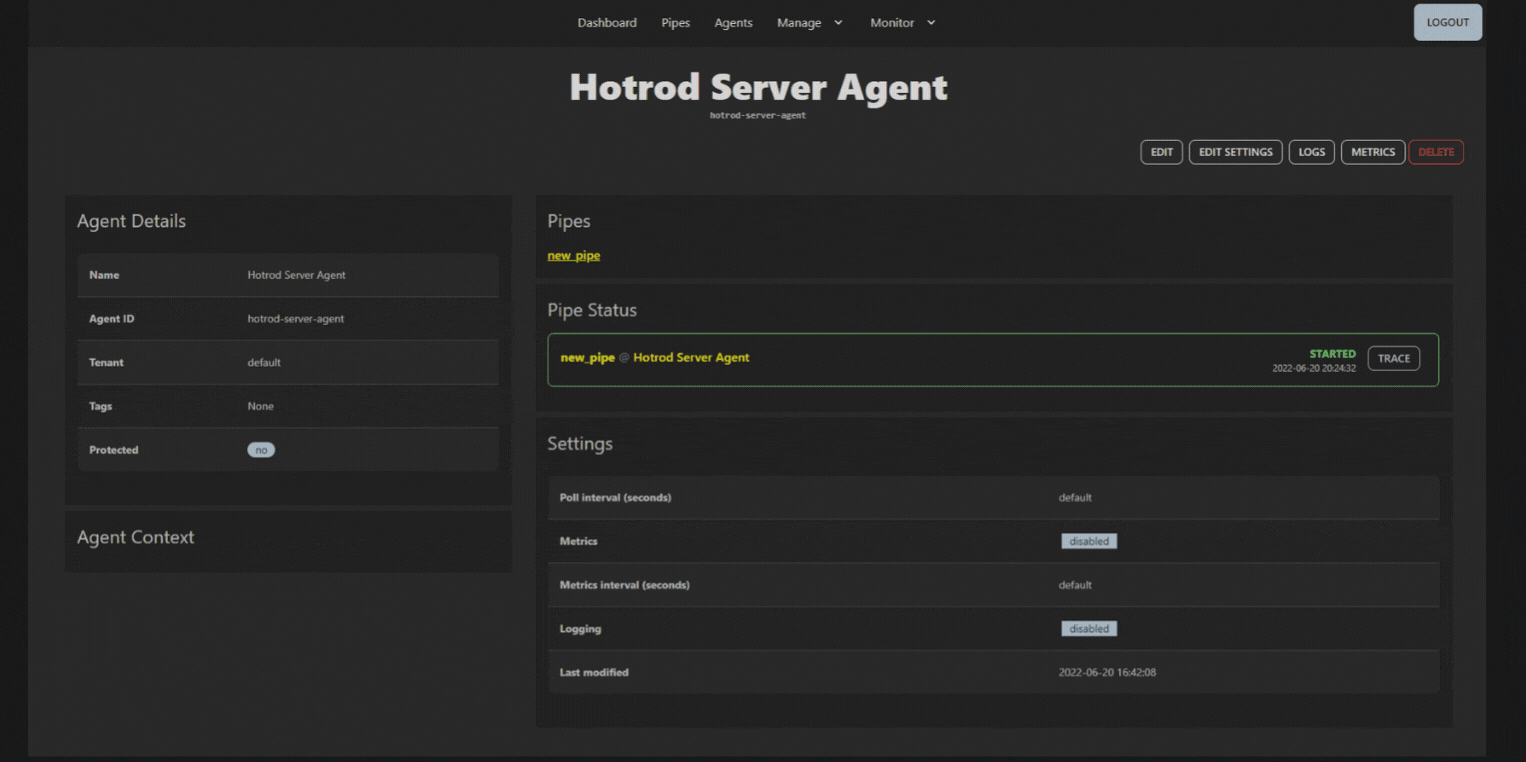
Running a trace
Once you're in the Agent View, you'll notice information including: agent details, pipes deployed to the agent, pipe status, and more. Since metrics and logging are disabled at this stage, click on the Edit Settings button where you'll complete a few steps to enable them.
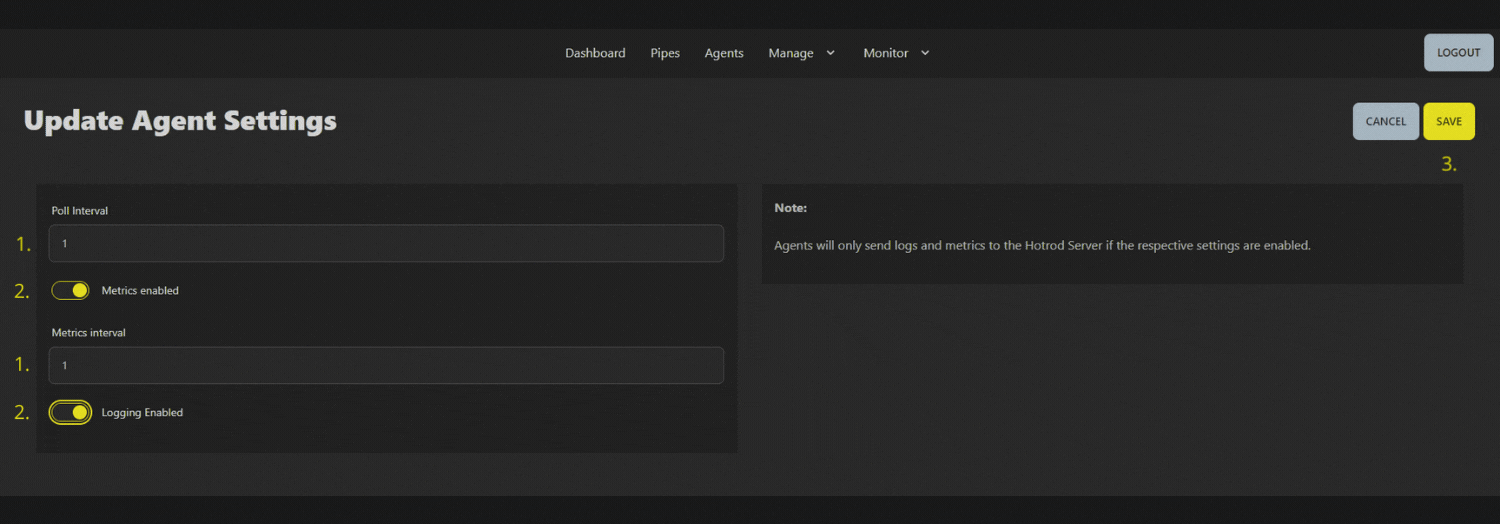
Inside Agent Settings:
- set poll and metrics interval values to 1 (seconds).
- enable metrics and logging by setting their respective buttons to on.
- click on Save.
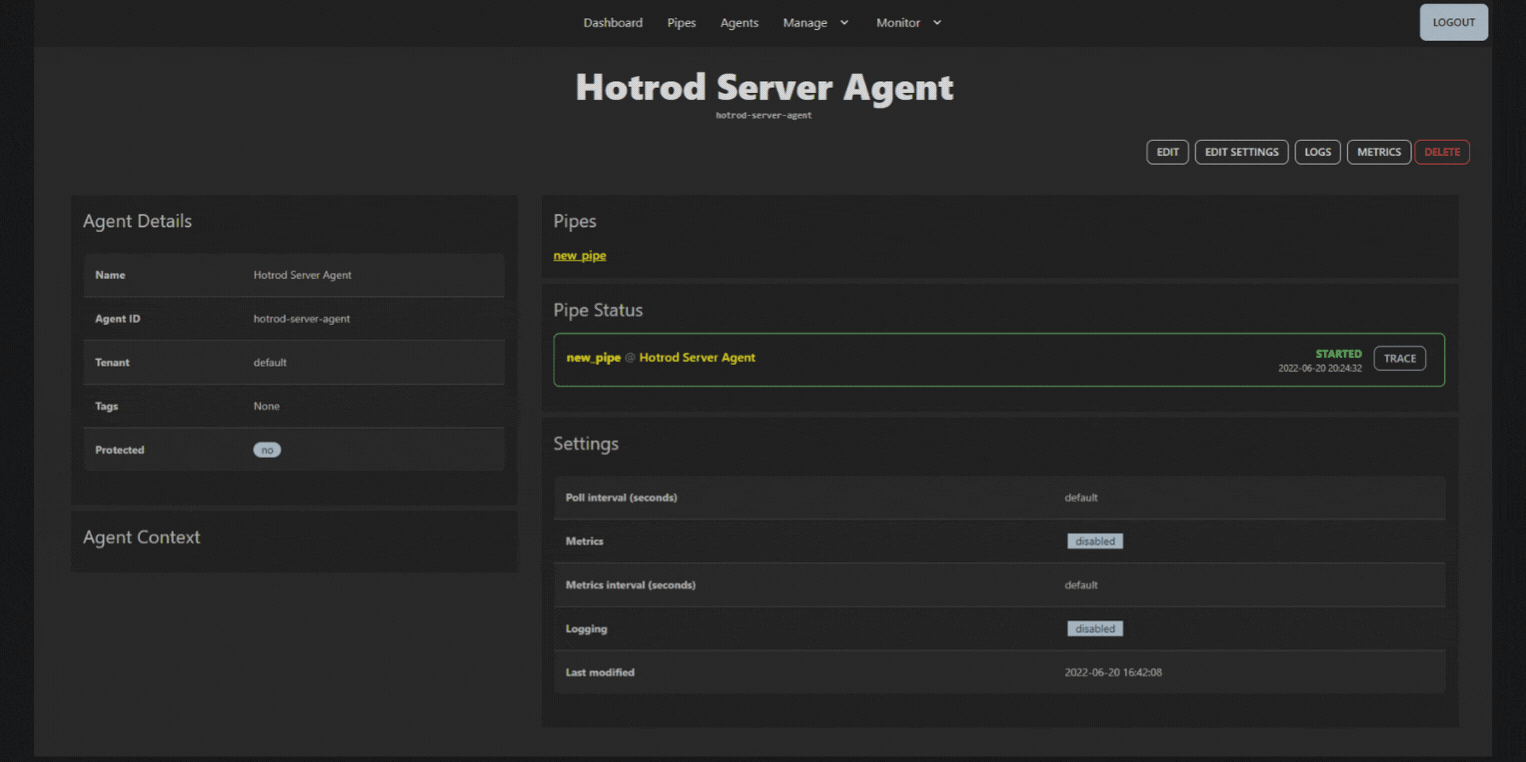
Once saved, you'll return to the Agent View where you can click on one of the pipe links to go directly to the Pipe View again.
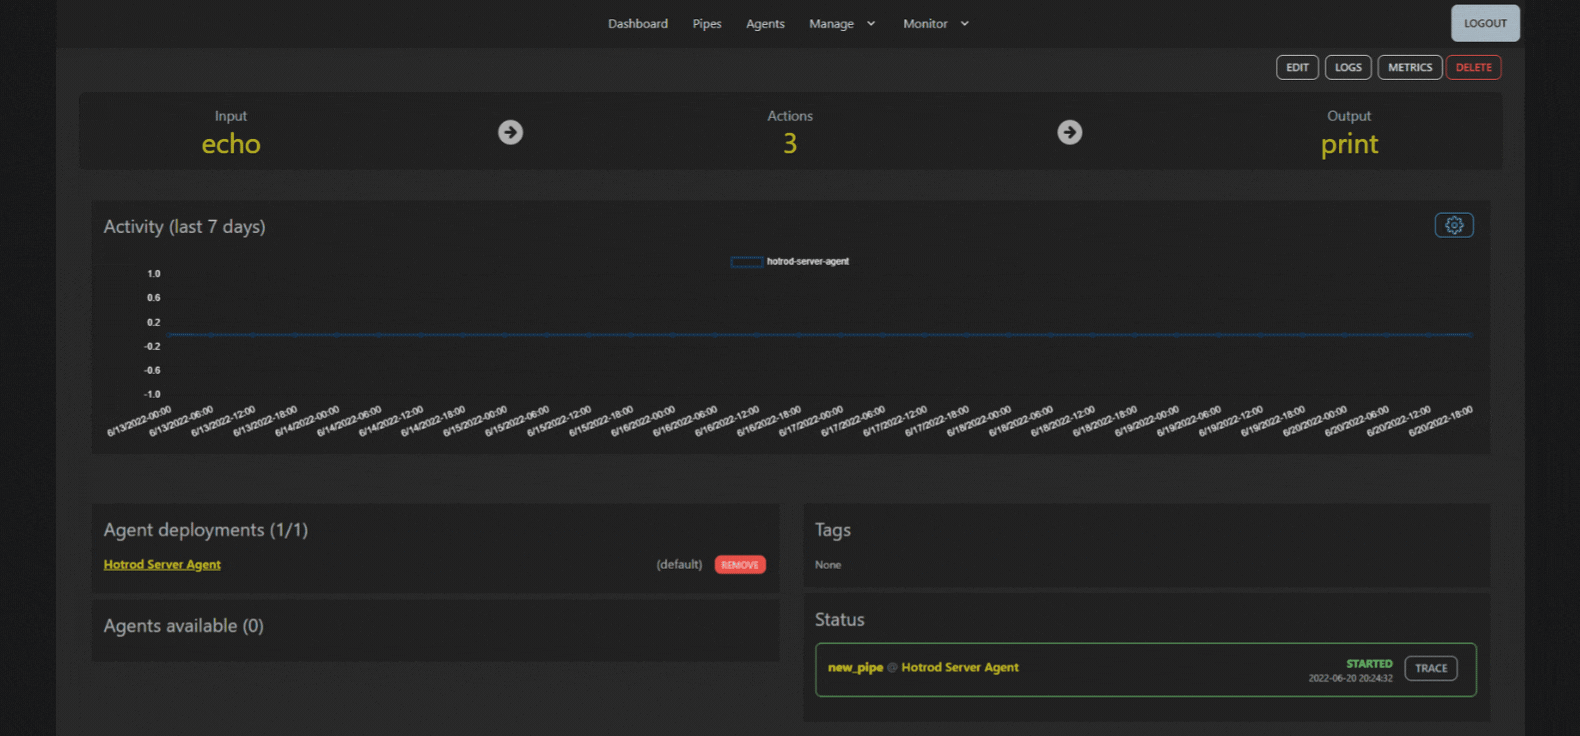
In the Pipe View at the bottom of the screen, click the Trace button.
On the next screen as shown below, you can set the amount of trace samples using the slider, then click on Start Trace to run the trace.

This initiates a trace, whereby the agent will start collecting the given number of event samples, and send them to the server.
The UI will wait until the server has collected at least one sample, and then display the trace results:
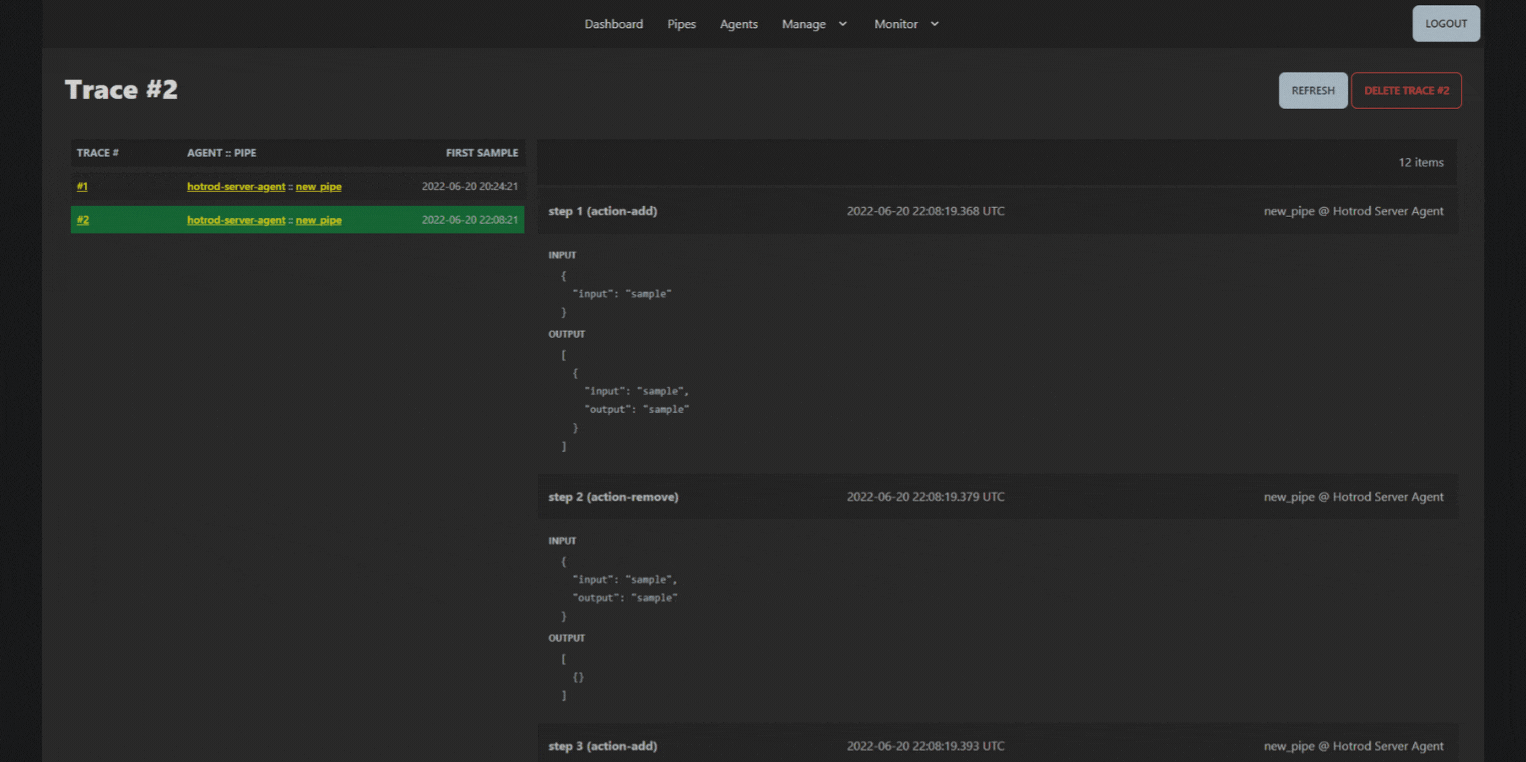
Notice that trace output includes the input and output data for each input, action and output in the pipe.
Traces are an essential diagnostic feature in Hotrod, for when you want to see what a pipe is doing during execution.
Next, click on the pipe link to return to the Pipe View.
Stopping a pipe
In the Pipe View you can stop the pipe, by clicking on the Remove button as shown in the screenshot.
Within a few moments, the agent will stop the pipe and notify the server that it is no longer executing the given pipe.
Next Steps
This concludes our quick start.
A complete installation guide is available for deploying Hotrod on Linux systems.